
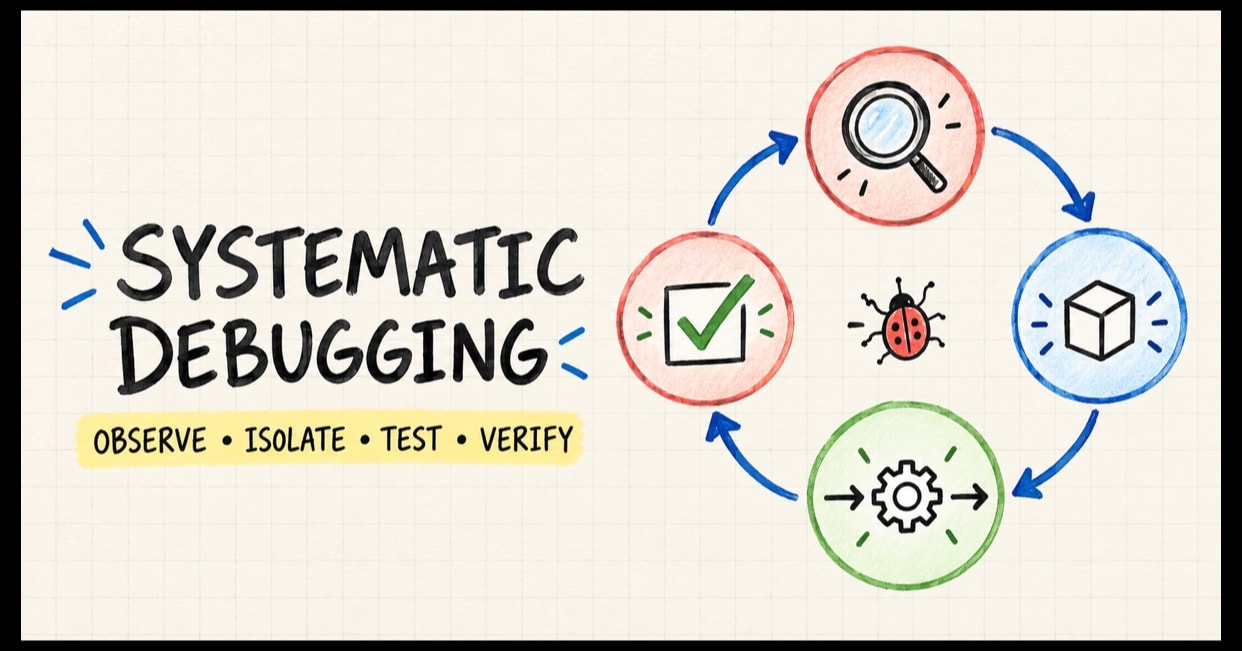
Systematic debugging turns a production symptom into a testable question. The fastest-looking response is often to guess, change several things, and hope the symptom disappears. That approach can hide the cause, introduce a second failure, and leave the team unable to tell whether the fix worked. A better debugging method is a short, evidence-led loop: reproduce the behaviour, reduce the case, inspect the boundary where it changes, test one hypothesis, and verify the result with a regression check.
This guide turns that loop into a practical method for local bugs and production incidents. It combines Google SRE troubleshooting practice, OpenTelemetry’s signal-correlation model, Git’s regression-bisection workflow, and HTTP’s rules for retry safety.
What systematic debugging actually means
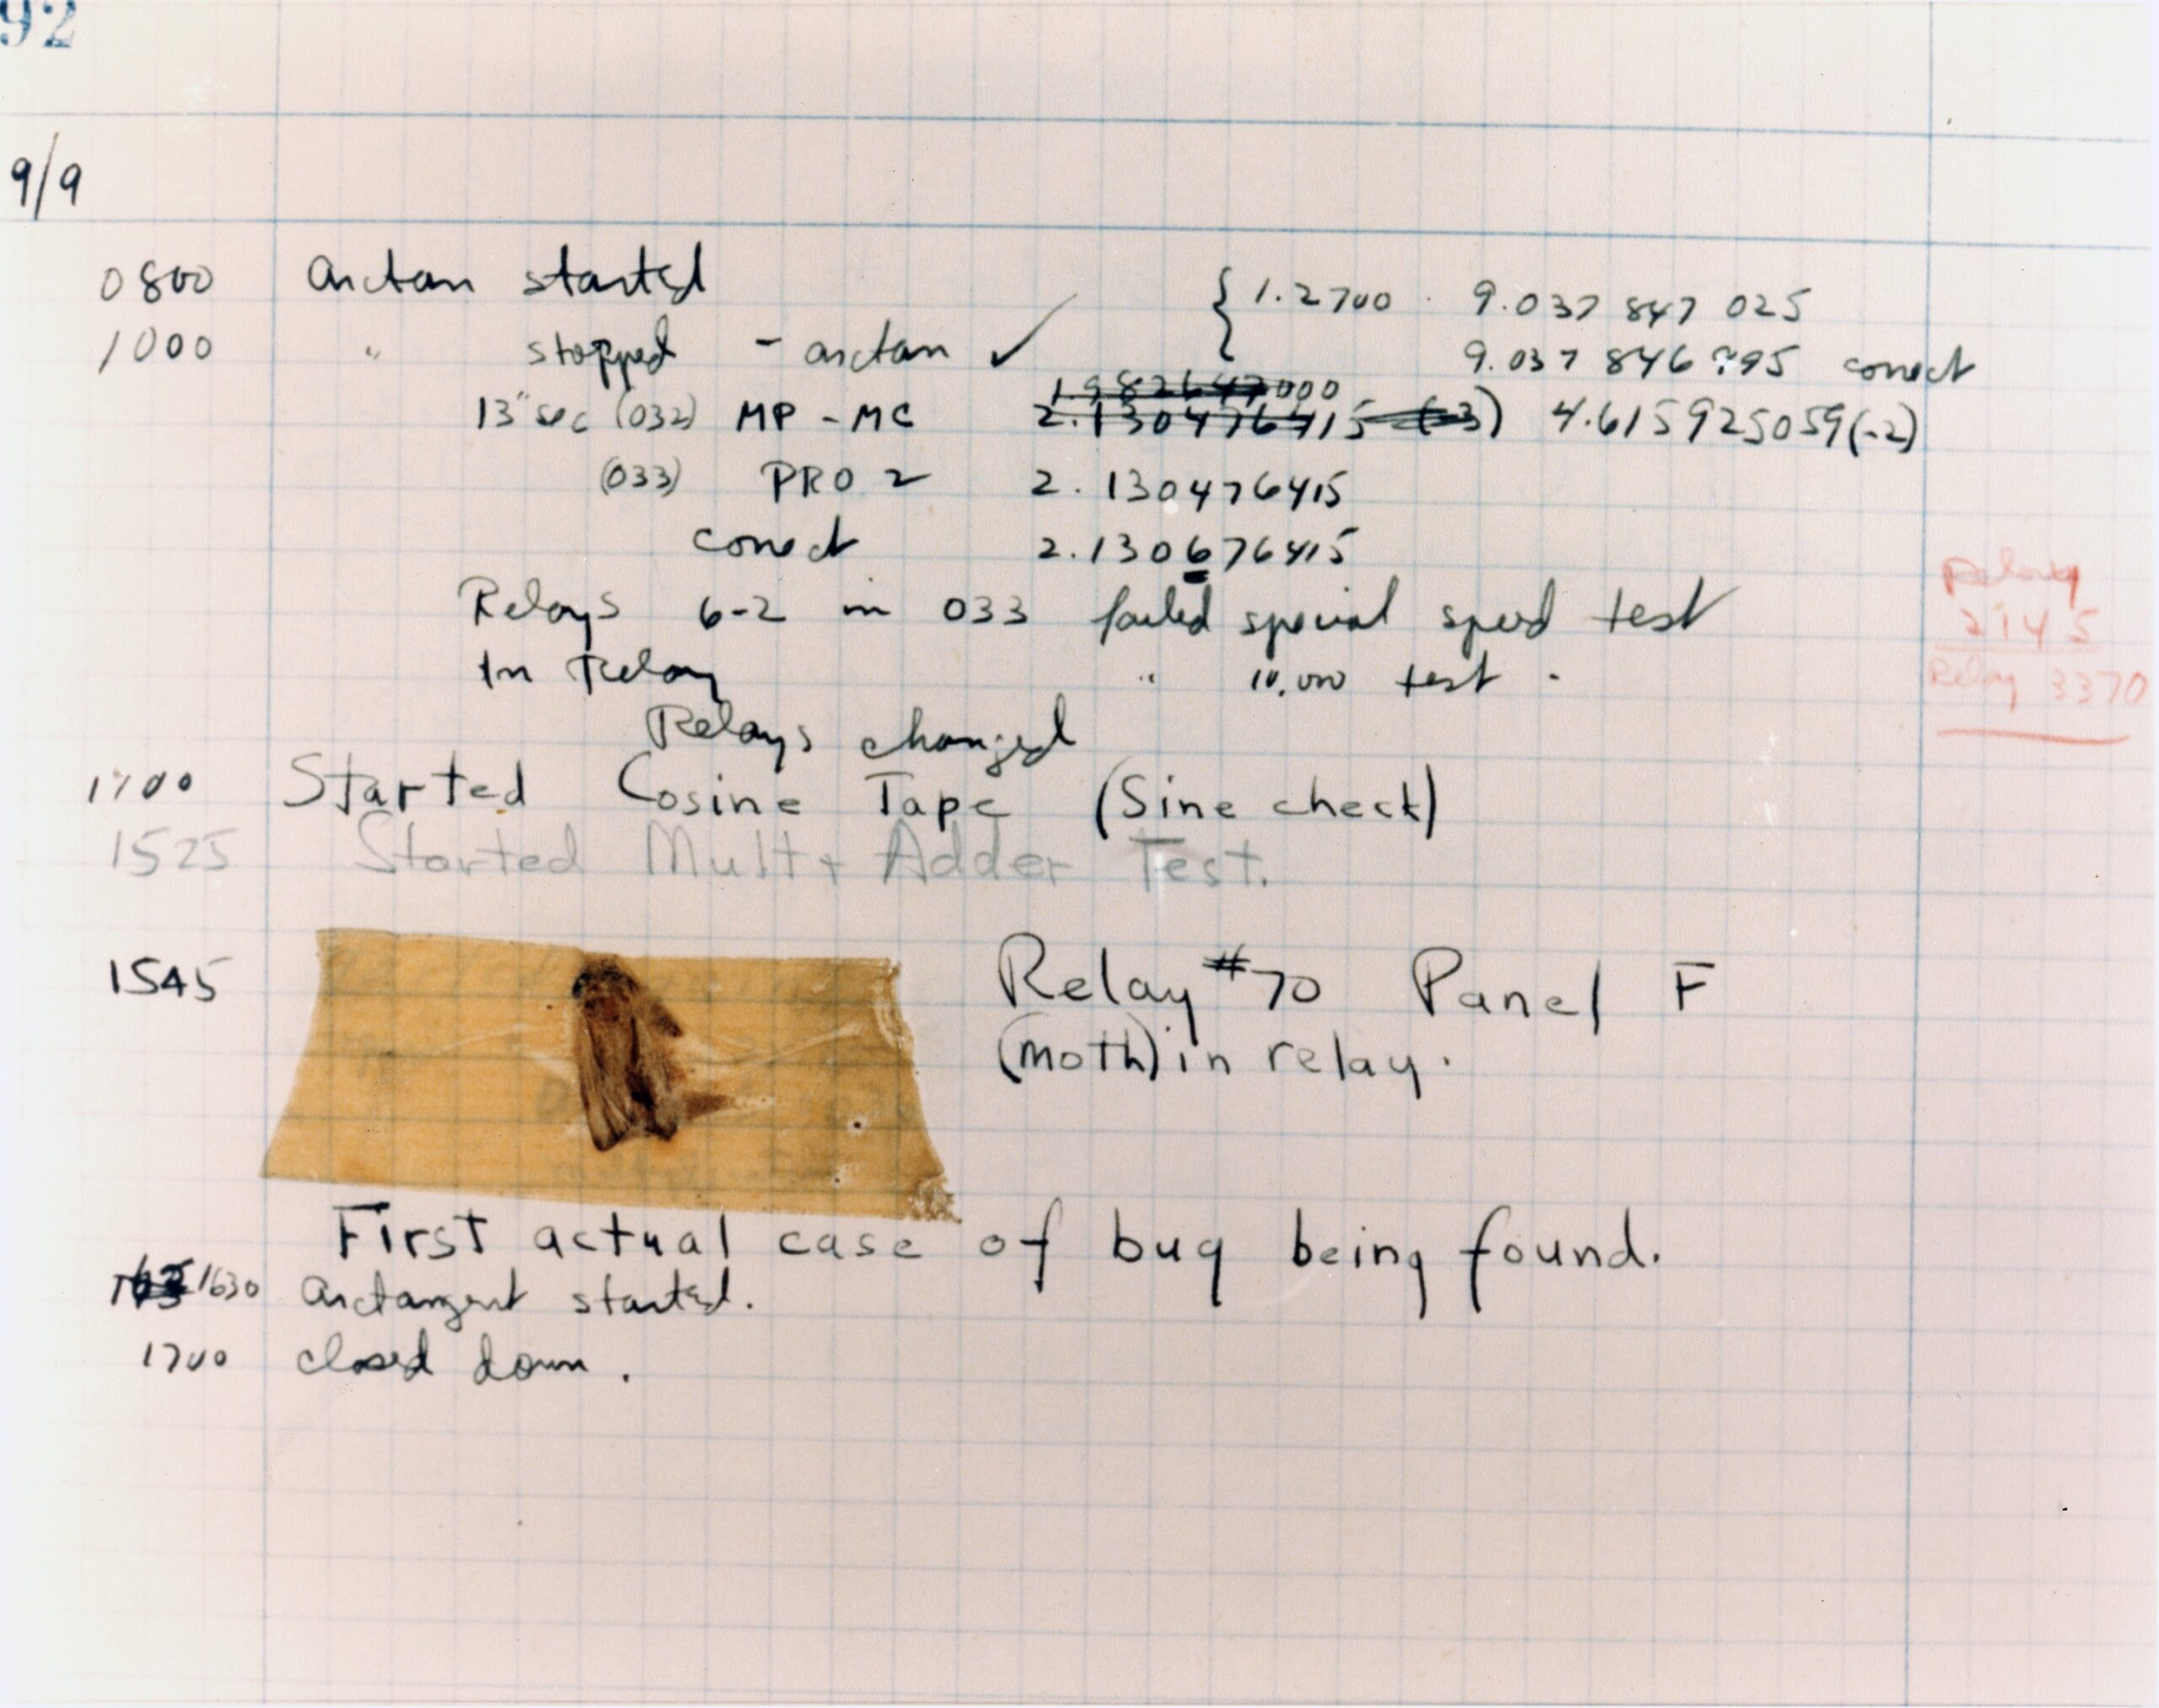
The familiar moth story is a useful reminder that a software symptom can have a cause outside the source code. In 1947, engineers found a moth lodged in a relay of Harvard’s Mark II computer and recorded it as the “first actual case of bug being found.” The Smithsonian records the logbook and notes that Hopper and the team helped popularise “computer bug” and “debug”; the story is not the origin of the word, which was already used for technical faults.

Systematic debugging is an application of the scientific method to software behaviour. Start with an observable difference between expected and actual behaviour. Use system knowledge, logs, metrics, traces, and code to form a small set of plausible explanations. Then choose a test that can distinguish between them. A useful hypothesis predicts what evidence should appear if it is true and what should happen if it is false.
For example, “the database is slow” is too broad to test. “Requests to GET /orders exceed the 800 ms target only when the query includes archived rows, and the database span accounts for most of the latency” is specific enough to investigate. It names the operation, condition, threshold, and evidence to collect.
Google SRE describes troubleshooting as repeatedly proposing and testing possible causes, using observed system state to confirm or disconfirm each one. It also warns that correlated events can share another cause, or line up by coincidence. A graph that rises at the same time as an error is a clue, not proof of causation. Google’s Effective Troubleshooting chapter gives a detailed version of this approach.
Why systematic debugging beats guesswork
Every uncontrolled change alters the conditions you are trying to understand. If you change a timeout, cache policy, and database query together, then the next result cannot tell you which change mattered. Keeping one deliberate variable per experiment preserves useful information, including negative results.
The goal is not to avoid intuition. Experience helps rank hypotheses. The goal is to keep intuition accountable to observations. Prefer likely explanations first, and consider both the information a test may provide and the risk of running it. A production experiment that changes traffic or adds verbose logging can create side effects; use a representative non-production reproduction when it is safe and practical.
For a major incident, debugging is only part of the job. First assess user impact and stabilise the service with a reversible mitigation, such as rolling back a suspected release or routing around a failing region. Keep a record of what changed and when. Root-cause analysis can continue after the immediate user harm is reduced. Google SRE’s incident guidance recommends coordination, clear roles, and a working record of debugging and mitigation. Incident Response includes concrete case studies of misdirected investigation and effective mitigation.
A five-step systematic debugging loop
1. Reproduce the failure under known conditions
Write down expected behaviour, actual behaviour, exact inputs, the user or tenant, environment, software version, configuration, and time window. Capture the complete error payload and a request or correlation identifier where available. Ask whether the failure is deterministic, intermittent, or tied to a particular event sequence.
Then make it happen again with the smallest reliable setup. A local test, staging environment, recorded request, fixture, or controlled replay can all work. Keep the original conditions that may matter: user permissions, relevant data shape, feature flags, timezone, and dependency versions. “It works on my machine” does not disprove a report if the two environments differ in one of those conditions.
If a failure cannot be reproduced, record that as a result. Do not quietly convert “not seen again” into “fixed.” For intermittent issues, increase the signal around the affected operation, retain representative inputs safely, and compare successful and failing executions.
2. Isolate the smallest failing boundary
Reduce the problem by removing inputs, steps, and components while preserving the failure. In a layered application, trace one known request from the caller through validation, authorization, application logic, storage, and response mapping. Test the input and output at each boundary. In a data pipeline, feed known records to each stage and compare the produced shape with the expected shape.
When the system is too large to inspect linearly, split the path in half. If the request is correct at the service boundary but wrong after persistence, focus downstream; if the response is already wrong before the database call, move upstream. Google SRE calls this a divide-and-conquer approach and recommends reproducible cases because they make safer experiments possible away from production.
For regressions introduced somewhere in a sequence of commits, git bisect automates this narrowing. Mark a known-good revision and a known-bad revision, then run a deterministic check at each selected midpoint. The official Git bisect manual describes the binary-search workflow and its limits: untestable commits or flaky checks can make the result uncertain.
3. Inspect the boundary and gather correlated evidence
Many hard-to-find defects occur where one component hands work to another. Check the request and response, authentication and authorization context, schema and serialization, cache key and invalidation, timeout and retry policy, feature flags, clock assumptions, and dependency behaviour. Compare the actual data at the boundary with the contract the next component expects.
For distributed requests, correlate logs, traces, and metrics instead of reading each signal in isolation.
A trace ID can connect spans across services; trace and span IDs in logs can make the relevant messages searchable. Metrics help establish whether the problem is broad, when it began, and how much it affects users. Logs and traces can then show what happened for a particular request. OpenTelemetry documents how context propagation links telemetry across service boundaries. See its context propagation guide and overview of logs, metrics, and traces.
Use the right signal for the question. A metric label with a unique user or request ID can create unbounded cardinality and make the metric system unusable; keep high-cardinality details in logs or traces, with access controls and retention suited to the data. Always check timestamp freshness and clock sources. Stale dashboards can make a real change appear ineffective or create a false timeline.
4. Test one falsifiable hypothesis
Choose one explanation and state the result you expect. If the hypothesis is “the retry creates a second payment when the first response times out,” write a test that sends the same logical payment twice and asserts that both responses refer to the same provider payment and that only one charge was created.
first = create_payment(order_id="order-42", amount_cents=2500)
retry = create_payment(order_id="order-42", amount_cents=2500)

assert retry.provider_id == first.provider_id
assert payment_provider.create_calls == 1
This test describes a contract; the application and provider must implement it. HTTP defines methods such as PUT and DELETE as idempotent in terms of intended effect, but a POST is not automatically safe to retry. An API may make a POST effectively idempotent with an idempotency key and durable server-side deduplication. Handle concurrent duplicates too: a non-atomic “check, then create” sequence can still process two requests at once. The HTTP Semantics standard warns clients not to automatically retry a non-idempotent request unless they know it is safe or know the original was not applied.
Keep each experiment narrow. Prefer a test that could disprove your idea over adding a log line that merely confirms the system passed through a place you already suspected. If a test changes production state, consider the blast radius, reversibility, and whether you have a safe rollback before running it.
5. Verify the fix and protect against regression
A fix is not proven because the error disappears once. Re-run the minimal reproduction, add or update a regression test, and run the relevant surrounding tests. Check that the expected behaviour holds for neighbouring cases: valid and invalid inputs, boundary values, permissions, timeouts, retries, and concurrent requests as appropriate.
For a production change, compare the same user-facing signal before and after in the affected time window. Confirm that the mitigation or fix did not move the failure elsewhere, and monitor after rollout. Record the version, configuration, test result, and any remaining uncertainty. For an incident, preserve a concise timeline and follow-up actions; a postmortem should help improve detection and prevention, not assign blame.
These habits connect debugging to broader engineering practice. For example, system boundaries and failure modes determine which signals you can inspect, while clear interfaces between components make it easier to isolate a fault.
Common edge cases that mislead a debugging session
- Time and expiry: check timezone, clock skew, daylight-saving transitions, and exact boundary comparisons. A token expiring “at midnight” is ambiguous unless the timezone and inclusive/exclusive rule are explicit.
- Caches: inspect the cache key, tenant or user scope, TTL, invalidation event, and whether the stale result is in an application, CDN, or browser cache.
- Retries and idempotency: distinguish “the server failed” from “the client did not receive the response.” The operation may have completed before the timeout.
- Concurrency: try overlapping requests and competing writes. A single-threaded reproduction may not exercise a race.
- Partial failure: check which sub-steps completed before the error and whether retry resumes safely or repeats completed work.
- Serialization and data types: compare actual wire values with schema expectations, including null versus missing, integer versus string, precision, and enum casing.
- Permissions and tenancy: reproduce with the same role and tenant boundary. A privileged administrator’s success does not establish that a normal user can perform the operation.
- Network and timeout behaviour: identify which hop timed out, whether the downstream operation continued, and whether retries amplify load.
Treat this list as a set of questions, not a universal checklist. Follow the signals relevant to the failure and be careful with tests that can mutate data or increase load.
Keep an investigation log that another engineer can continue
A useful log is short and concrete. Record the observation, one hypothesis, the test, the result, and the next step. Include timestamps and links to the relevant request, dashboard, trace, code change, and test run. Mark conclusions as confirmed, disproved, or still uncertain.
| Observation | Hypothesis | Test | Result | Next step |
|---|---|---|---|---|
| Duplicate payment reported after a timeout | Retry is not deduplicated | Replay the same order key twice against a test provider | Two provider IDs returned | Add atomic idempotency handling and a concurrency test |
This prevents repeated dead ends and makes negative results useful. It also reduces the chance that a teammate changes a condition you already tested without realising it.
Systematic debugging checklist
- Describe expected versus actual behaviour with scope, version, input, and time.
- Reproduce the failure and reduce it to the smallest useful case.
- Trace data across component boundaries and correlate logs, traces, and metrics.
- Write one falsifiable hypothesis and run a low-risk test.
- Change one relevant variable at a time and record the result.
- Add a regression check, verify neighbouring cases, and monitor the rollout.
- During incidents, reduce user harm first and preserve the evidence needed for root-cause analysis.
The most reliable debugging session is not the one with the most clever guesses. It is the one that turns uncertainty into a reproducible observation, learns from each test, and leaves behind a fix that another person can verify.